Your fields
Intelligently analyzed
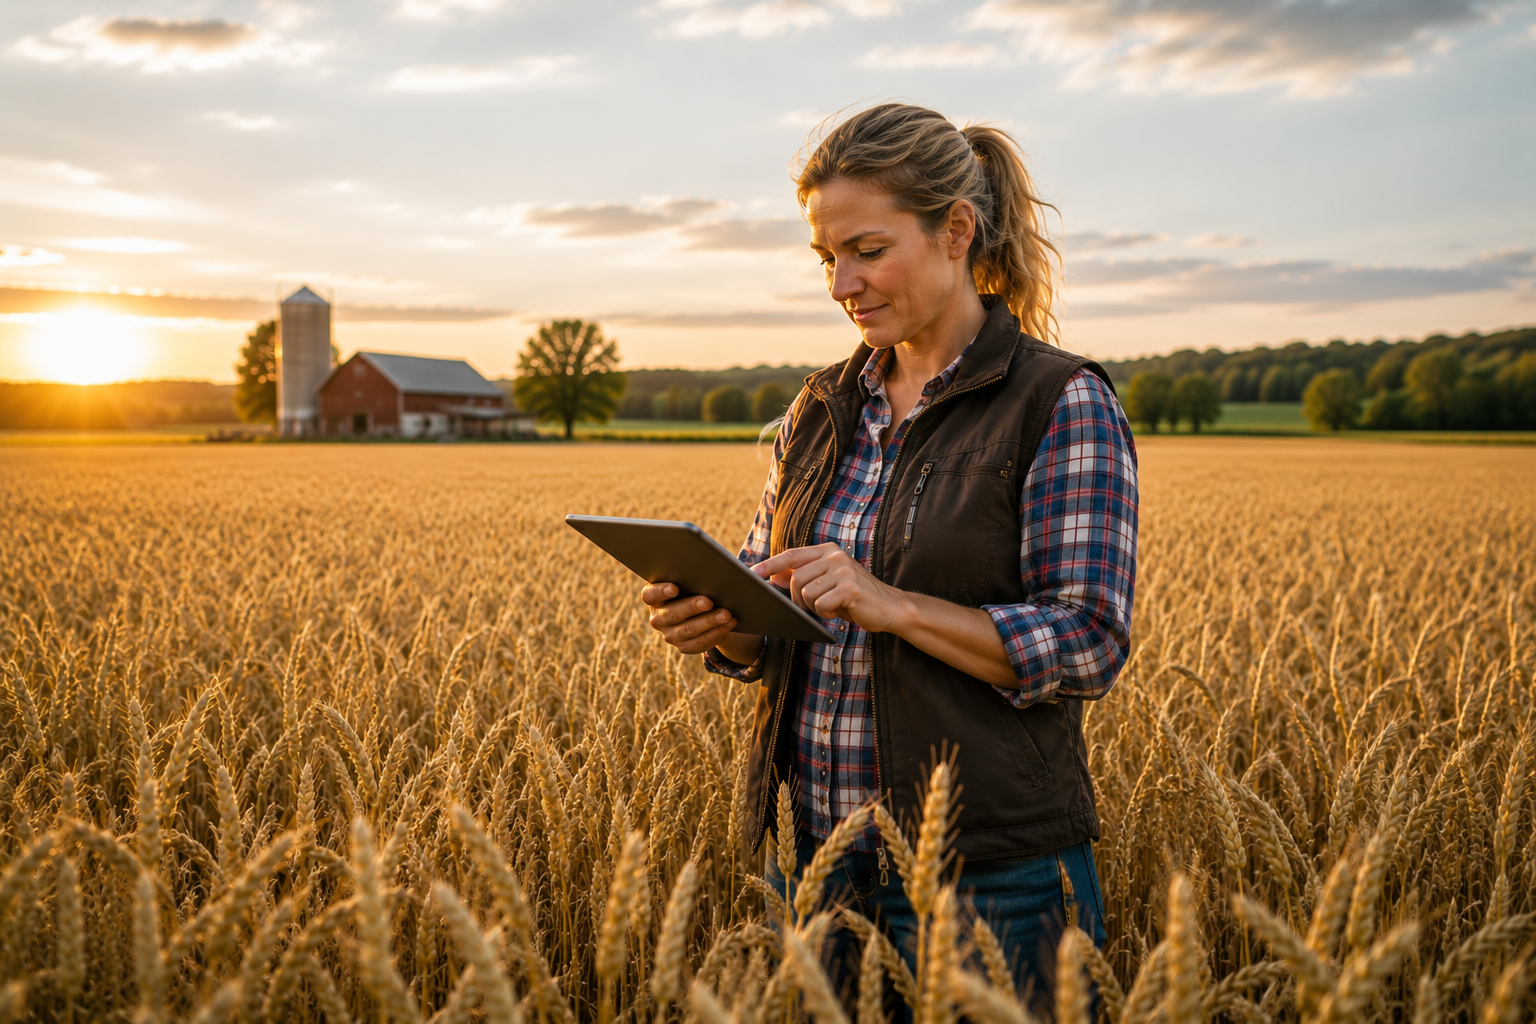
AgroScan combines remote sensing, machine learning and an easy-to-use visual workflow. Simply select your agricultural field to receive a detailed map of its soil organic carbon content!

One click to become a carbon connoisseur
Select the polygon drawing tool on the map, click around the edges of your field, and start the analysis.
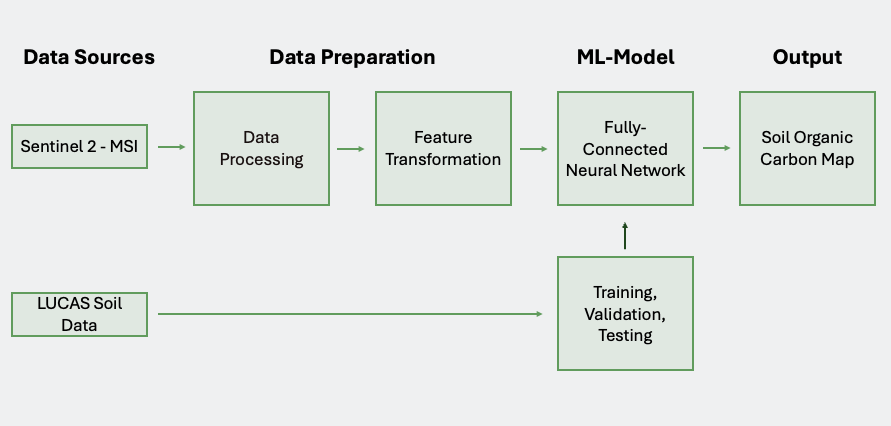
The program splits the selected polygon into a 60x60 m grid and predicts the agricultural soil organic carbon content using a machine learning model.
→ Try out nowSatellite driven decision support
The machine learning model is trained on Sentinel-2 data as well as vegetation and soil indices. It utilized only free, publicly available data and is fully open-source making it easy to customize to your own use case. Curious? Read our report or checkout our GitHub repository.
From classroom to climate impact
AgroScan grew out of the elective course AI4GOOD: Human-Centered AI for Social Good — Peace, Health, Climate at ETH Zurich. Offered by the IVIA Lab (Interactive Visualization & Intelligence Augmentation), the course brings together computer science with peace and security, global health, and climate science.
Students move from seminar discussions to hands-on projects: they build AI prototypes on public data and reflect on ethical and societal implications along the way. AgroScan applies that approach to precision agriculture by providing open-source, satellite-based soil organic carbon maps that farmers and researchers can use without proprietary lock-in.
Developed with the user in mind
AgroScan has been developed to meet the needs of users. Find out more about the two farmers who helped us design our website.
Roadmap
Prototype development
Literature research, ML model programming and training, initial web-app development with FastAPI and Jinja2, and integration of the model into the application.
First version for project submission
Finalizing UX and design, deployment, project documentation, and presentation for course submission — the current AgroScan v1.0.
ML model improvements
More data sources, local input, and higher-resolution predictions.
Community forum
Connect with other farmers and share AgroScan ideas.
Baseline & historic analysis
Historic analyses and baseline charts for your fields.
Track your progress
SOC goals, progress tracking, and light gamification.
Chatbot recommendations
Personalized recommendations for sustainable soil management.
The roadmap above is a quick overview. For more detail on all planned features — from model improvements to community tools — visit the Future Work page.
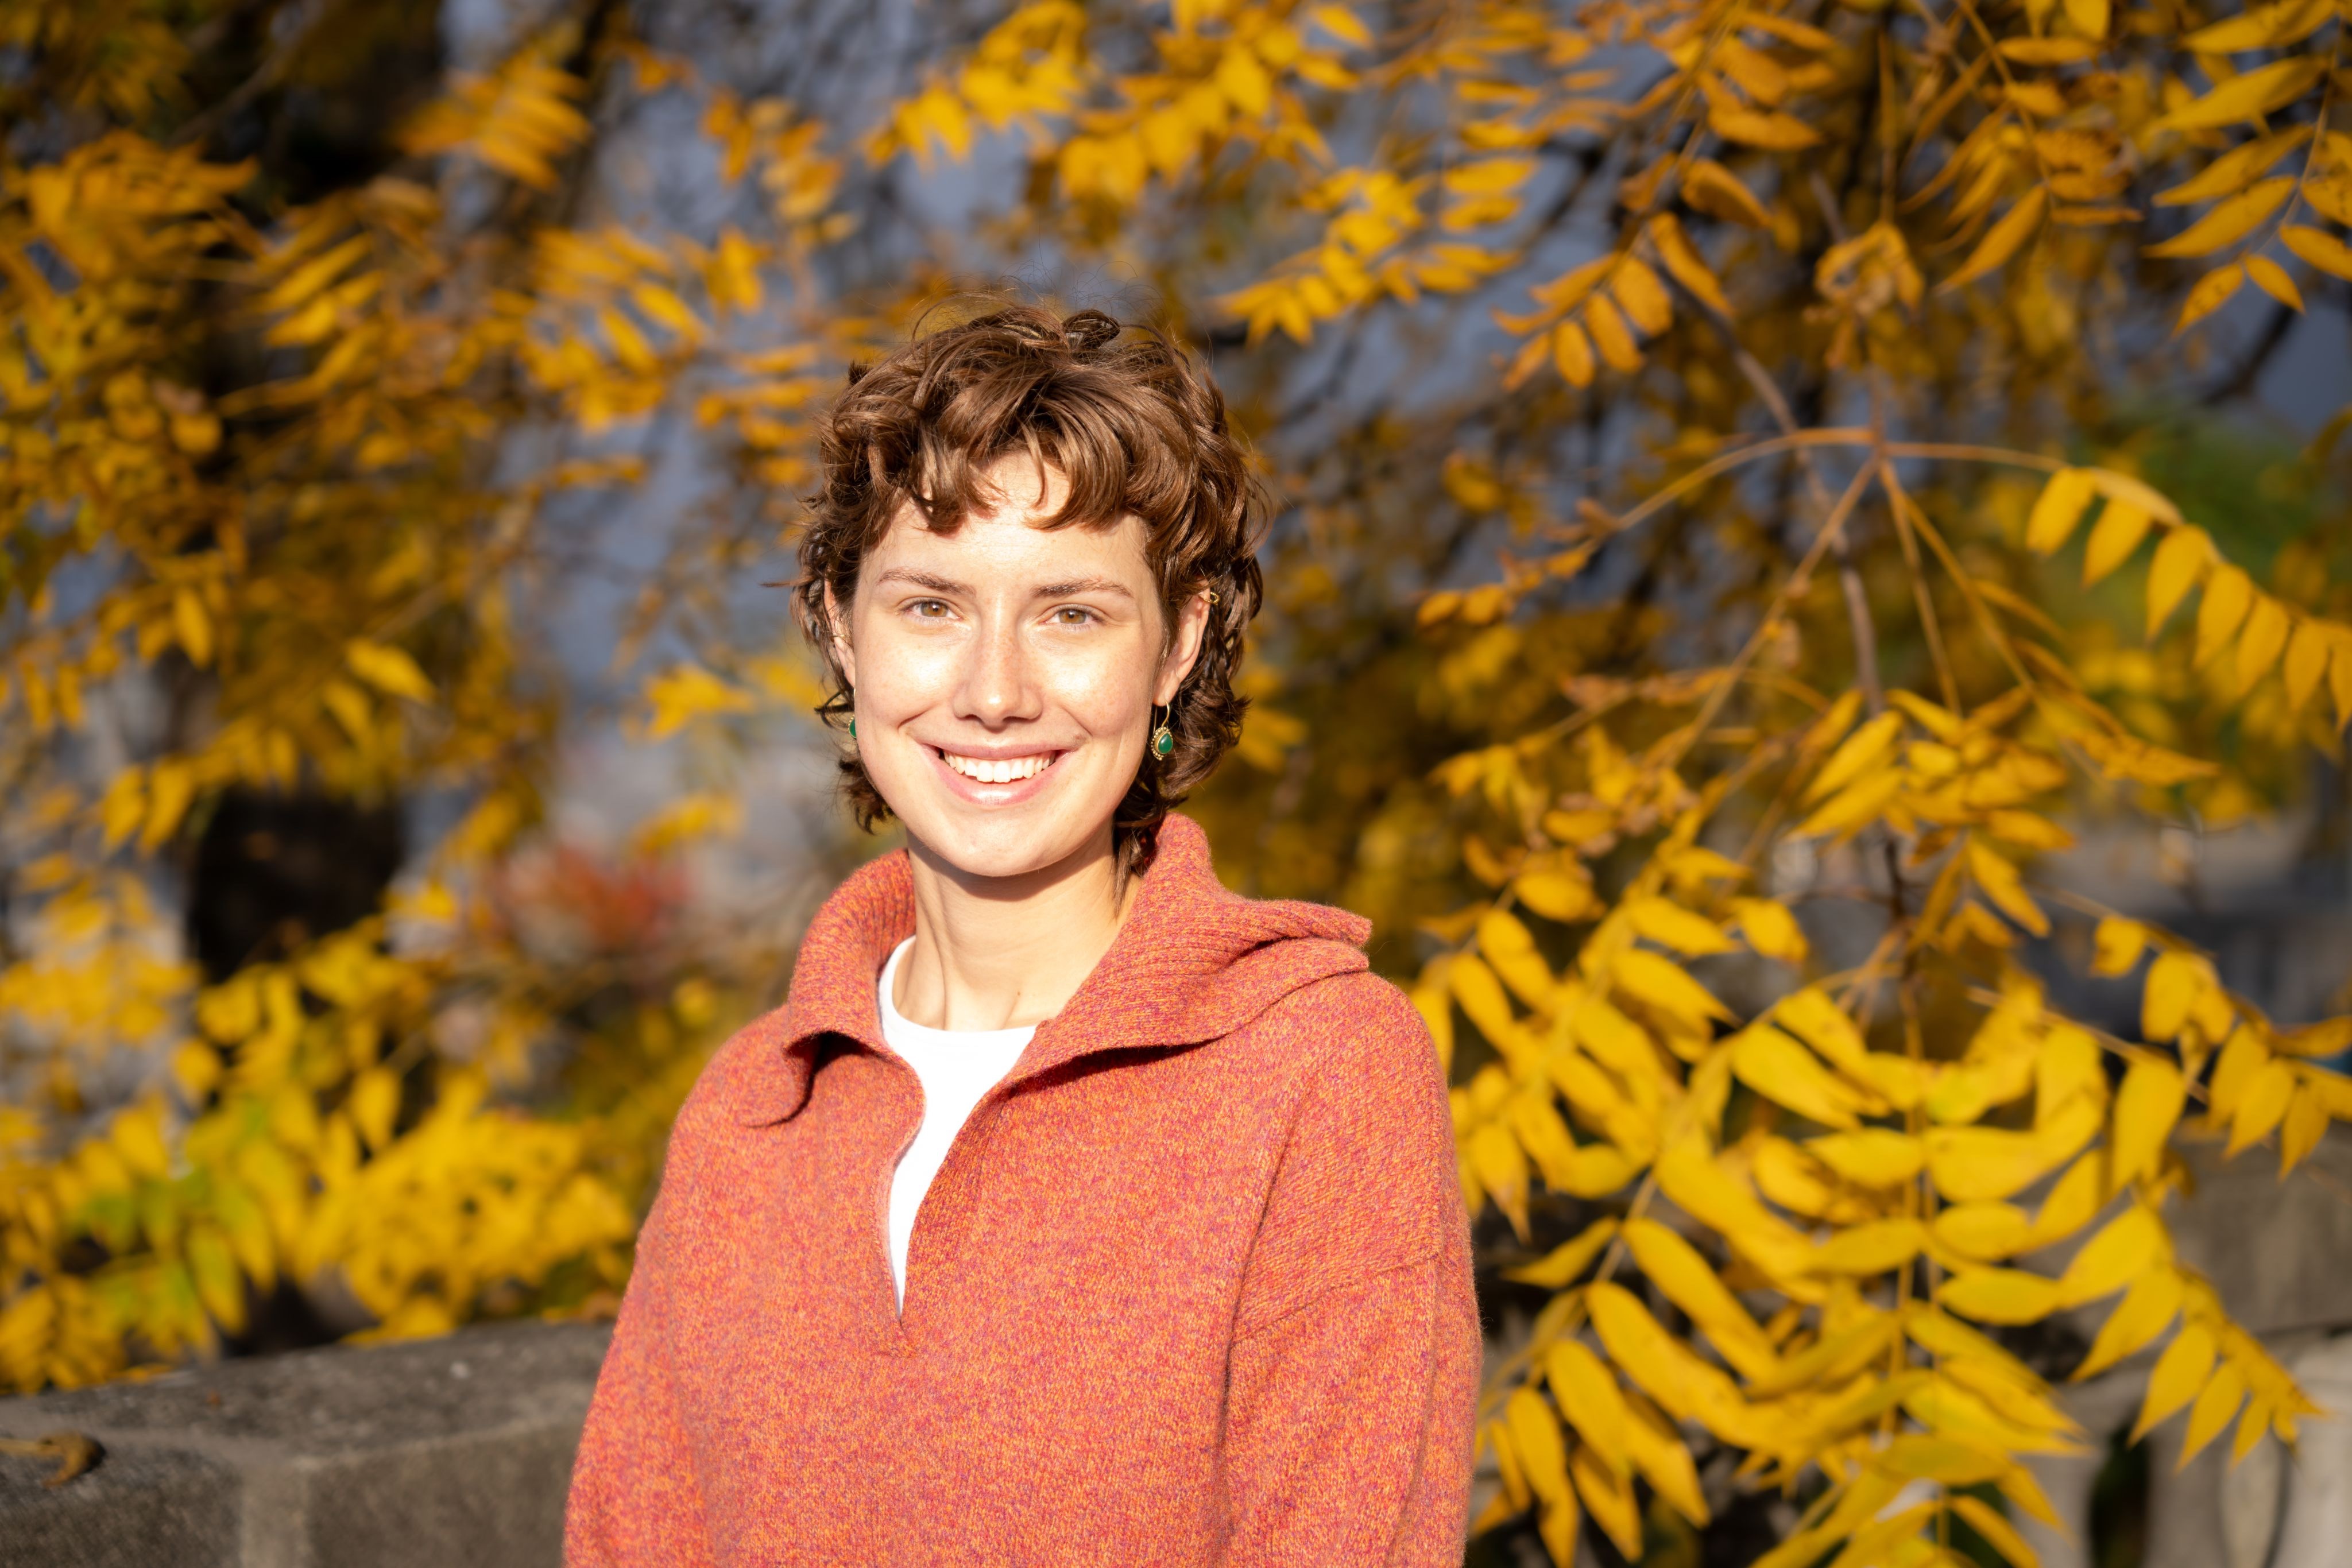
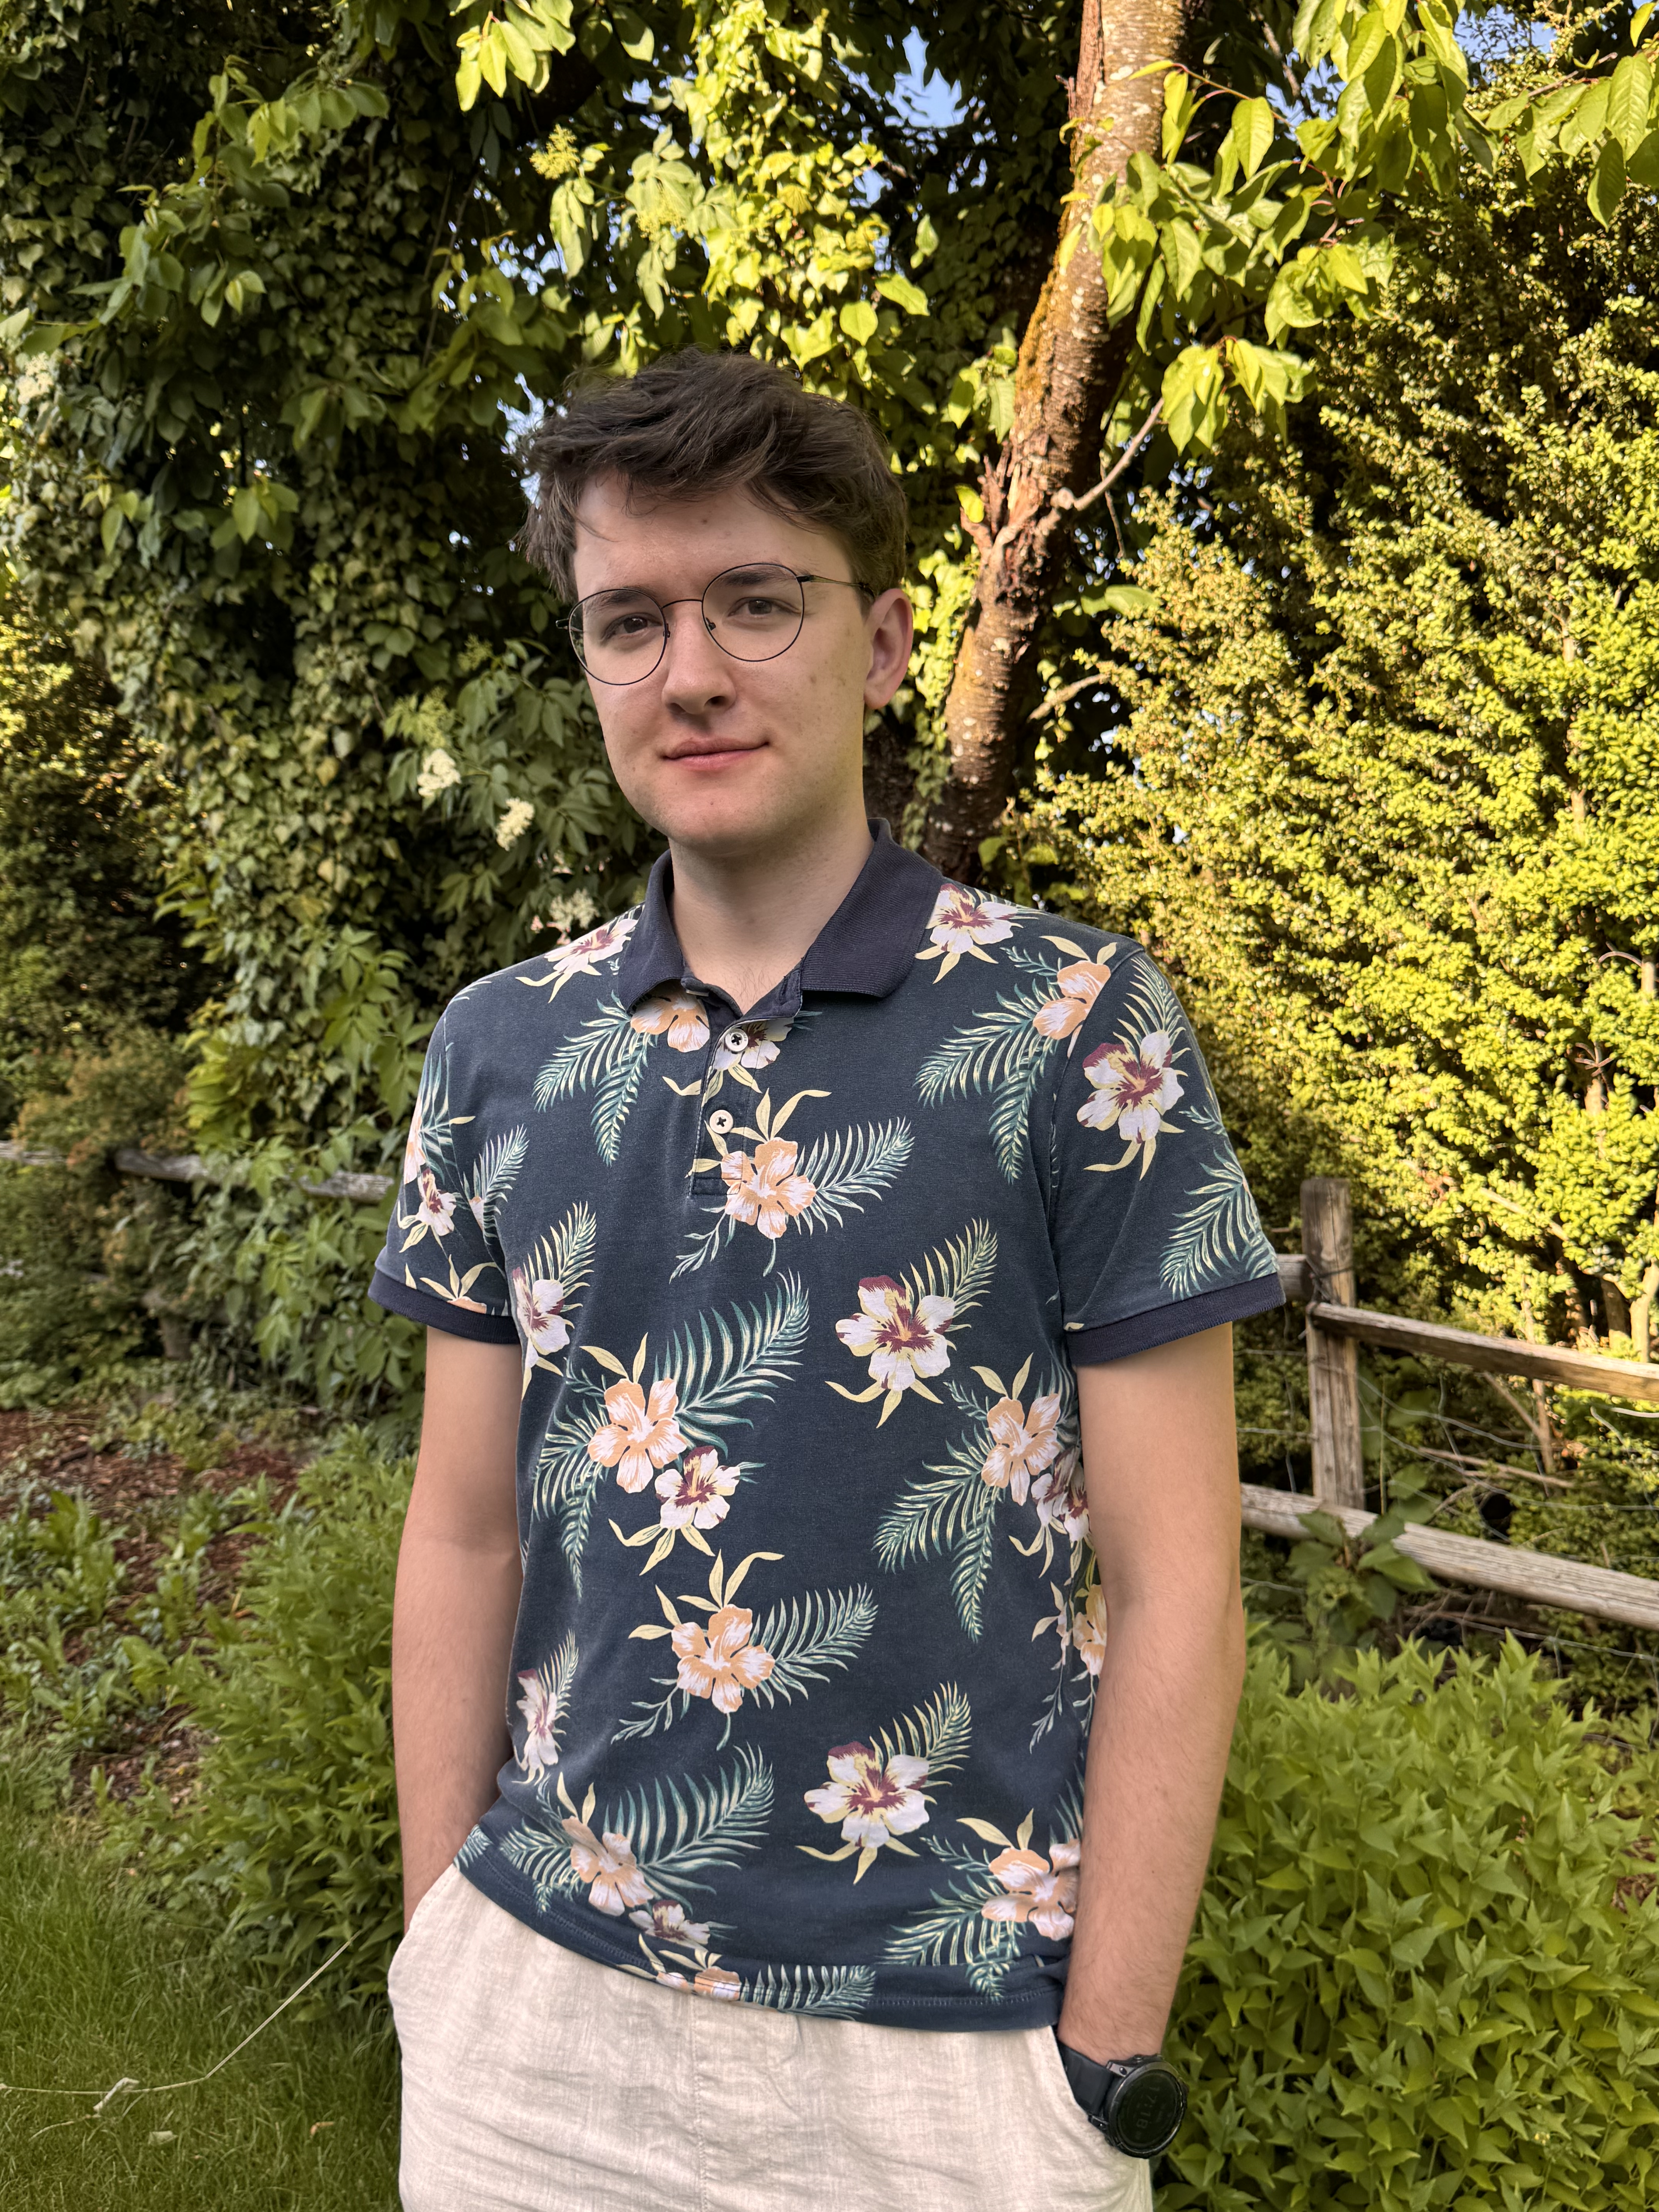
The faces behind the Project


Ready for smart field analysis?
Go to the analysis page and draw your first polygon.
→ Start analysis